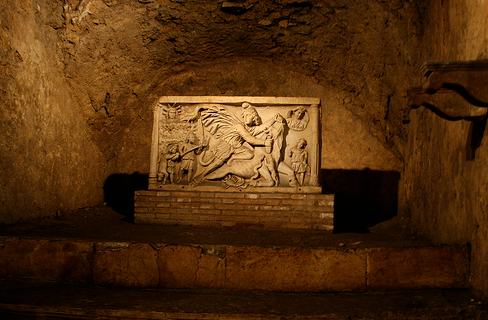
NESLab runs a number of IoT deployments at different places. One example is the zero-maintenance IoT deployment we are running at the Mithræum of Circus Maximus, a UNESCO-protected underground archaeological site in Rome (Italy). Unique to our work is the use of energy harvesting through thermal and kinetic energy sources. Unlike existing energy-harvesting deployments that are limited to a few months of operation in the best cases, our system has been running with zero maintenance for more than 3 years, including 3 months of site inaccessibility due to a COVID19 lockdown. This project is about building a graphical dashboard showing the sensor data coming in real-time from the Mithræum and other similar IoT deployments we are running. We plan to use modern dashboard tools like Graphana. The project is part of the research activities of NESLab.